

- Home
- The Trip
- Havana
- Cienfuegos
- Trinidad
- Santa Clara
- Varadero
- Matanzas
- Playas del Este

- On my Mind
- Safety & Scams
- Money & Transports
- Telephones
- About
- Useful websites
Cuban Economy
The exchange rate between the CUP and the CUC has never been an indication of the true value, but more like the government’s way to ensure that the Cubans don't buy too many expensive goods from abroad.
Lately things have been changing rather quickly money wise.
After accepting the US $ for more than a decade, here’s what has happened:

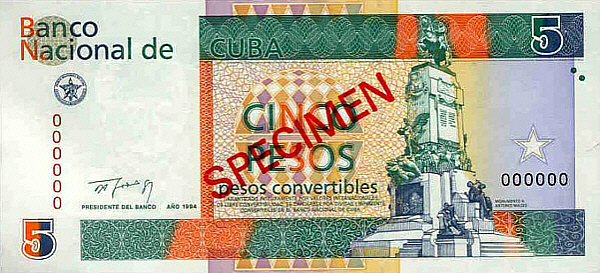
| Nov. 8th 2004 | USD is out. Convertible Pesos (CUC) is in. One CUC equals one USD |
| Feb. 20th 2005 | The exchange rate between Pesos Cubano (CUP) and CUC went from: Before: 27 CUP for one CUC Now: 25 CUP for one CUC |
| April 9th 2005 | The CUC is no longer tied to the USD. That is - it’s still quoted to be 1.08 of that of the arch-enemy! |
| May 1st 2005 | The minimum wages for workers were raised from 100 to 224 CUP a month - aka raised from 4 to 9 CUC a month. |
| The minimum social pension was raised from 55 to 150 CUP a month. - aka from 2 to 6 CUC a month. |
Here’s an example of the difference in CUC / CUO value:
A 30 minute bus-ride with the local bus cost me 0.2 CUP - that’s about 5 times less than the smallest Danish coin.
On the return trip I took a taxi, and I paid 9 CUC for the ride.

In other words:
The trip with the taxi cost me more than 1.100 times that of the bus.
The cost of petrol alone by far exceeds the revenue from the bus tickets.
The modern word for this would be “subsidised”, but to me it’s more a consequence of the idea:
| If you deny people buying-power, you'll end up buying power for the people. |
Although the GDP per capita is about $ 10.000, the average Cuban only receives about $ 300 in annual salary.
In real life that’s 97% in tax!
Source: |
Haiti |
Honduras |
Cuba |
Jamaica |
Venezuela |
Dom. Rep. |
Mexico |
Bahamas |
GDP - per capita (US $) |
1,181 |
4,130 |
10,291 |
8,269 |
12,491 |
8,763 |
13,779 |
28,473 |
Unemployment rate |
40.60% |
5.10% |
1.60% |
12.90% |
13.59% |
13.30% |
5.40% |
7.60% |
Literacy |
52.90% |
80.00% |
99.80% |
87.90% |
93.00% |
87.00% |
86.10% |
95.60% |
Infant mortality |
52.02 |
20.44 |
4.90 |
14.60 |
20.62 |
22.22 |
17.29 |
13.48 |
Life expectancy at birth |
62.17 |
70.61 |
77.70 |
73.45 |
73.93 |
77.31 |
76.47 |
71.18 |
Telephones |
11 |
101.92 |
105.35 |
105.39 |
248.48 |
96.96 |
170.81 |
411.73 |
Cell phones |
375 |
947.25 |
39.96 |
1,035.78 |
1,017.67 |
866.76 |
752.06 |
1,145.18 |
Internet users |
103 |
89.85 |
144.85 |
551.18 |
322.70 |
271.28 |
272.77 |
369.60 |